Intermediate Series
What Are Moving Averages?

Moving Averages are one of the most powerful and versatile technical indicators that traders can use to make smarter decisions. It’s a momentum indicator that helps technical traders make sense of the ever-changing, volatile cryptocurrency markets.
Smoothing out volatile price movements helps traders identify longer-term trends and get a quick overview of the markets, separating the signal from the noise. Moreover, combining different Moving Averages together can create even more valuable trading signals, including bullish and bearish divergence along with Moving Average Convergence Divergence (MACD).
In this article, we’ll cover exactly what all of those indicators are and how traders can use them to make smarter trades. By the end, you’ll see why Moving Averages are one of the most fundamental indicators that technical traders use to make a profit from price movements in different cryptocurrencies.
Contents
- Where can you find different cryptocurrency’s Moving Averages?
- The three key types of Moving Averages
- How to use Moving Averages in your trading
- Conclusion
Where can you find different cryptocurrency’s Moving Averages?

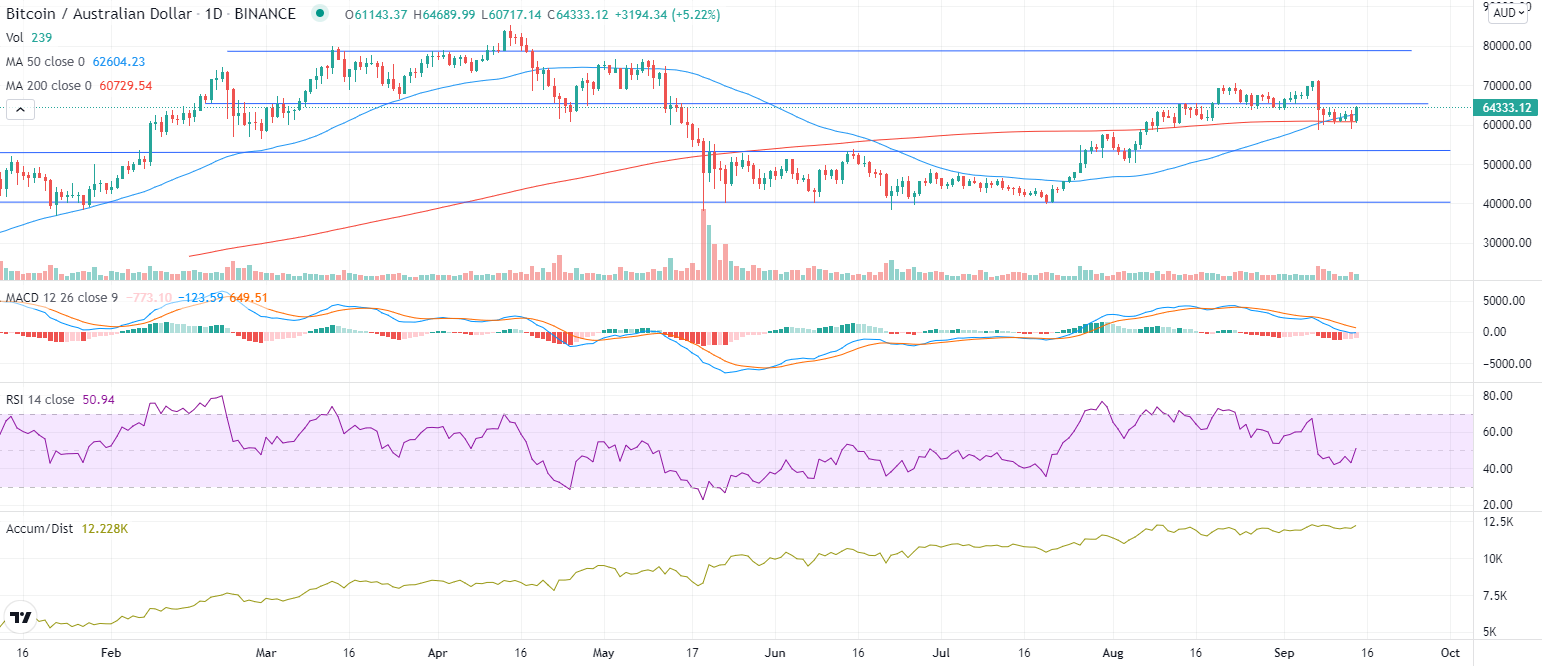
When you sign up to Cointree’s exchange, you’ll receive a market update every week that includes our Technician’s Take, an analysis of bitcoin’s technical indicators which usually include the 50 day or 200 day Moving Average. In a recent update, highlighted in the chart above, you can see how the price bounced off of the 200 day Moving Average (this is a common occurrence as the 200 day Moving Average often acts as the support level).
The above chart is taken from Trading View, which provides a number of Moving Average indicators you can access for free. Luckily, along with our weekly update, there are some free resources you can use.\ \ Here are some more free websites that show Moving Averages for different cryptocurrencies:
The three key types of Moving Averages
1. Simple Moving Average (SMA)
The Simple Moving Average is an indicator that calculates the average closing price of a cryptocurrency over some number of days. The 50 day and 200 day Moving Averages are the most frequently used by crypto traders. The result is usually displayed as a line graph set against the price.
2. Weighted Moving Average (WMA)
The Weighted Moving Average is similar to the SMA, except it applies different weightings to each data point. The most common method of weighing the MA is to assign a heavier weighting to more recent price points, so that it’s more reflective of recent price changes.
3. Exponential Moving Average (EMA)
The Exponential Moving Average is another version of a WMA that is more closely aligned with recent price movements. The difference between the WMA and EMA is that the EMA rate of decrease between one price and its preceding price decreases exponentially.
How to use Moving Averages in your trading
Traders use Moving Averages in a variety of ways. Some traders rely on Moving Averages to identify support and resistance levels and others use them to simply set more profitable entry points for long term investments.
Other traders use Moving Averages to generate automated buys and sell signals when the price meets a predetermined level. The better you understand these indicators, the more you’ll be able to incorporate them into your trading strategy.
As with all technical analysis tools, Moving Averages should not be used as a stand-alone trading strategy. It is widely advised to incorporate Moving Averages with other forms of cryptocurrency analysis. That being said, they’re an awesome indicator and can help you in a myriad of ways.
1. Bullish crossover
A bullish crossover is said to confirm upwards trends. It occurs when a short-term Moving Average crosses above a longer-term Moving Average, also known as a ‘golden cross’.
For example, if the 50 day Simple Moving Average (SMA) breaks above the 200 day SMA, this bullish cross will confirm that there are more buyers than sellers for that asset at that given time.
2. Bearish crossover
A bearish crossover is when a short-term Moving Average crosses below a longer-term Moving Average, confirming a downward trend. It’s also known as a ‘death cross’.
For example, if the 50-day Moving Average crosses below the 200 day Moving Average, that would be considered to be a bearish crossover by many traders. This would confirm the downward trend for traders looking to sell.
3. Moving Average Convergence Divergence (MACD)
The MACD is used to monitor the relationship between two different Moving Averages. When the MACD is positive, that means the short-term Moving Average is sitting higher than the long-term average, implying an upward trend. When the MACD flips from negative to positive, some traders use this as a buy signal.
Inversely, when the MACD is negative that means that the short-term Moving Average is lower than the long-term Moving Average. When the MACD turns from positive to negative, some traders interpret this as an indicator to sell.
Conclusion
Moving Averages are one of the most popular tools for traders because they allow users to quickly identify the general trend direction, smooth out erratic price data, and identify bullish and bearish divergence and MACD.
While Moving Averages can be used to generate a wide variety of trading signals, they should not be relied on as a single source for market timing or trade entry/exit decisions. Instead, it’s best to incorporate them into your trading strategy along with other types of cryptocurrency analysis, including financial metrics and the Relative Strength Index Indicator (RSI).
Whether you’re a beginner or expert trader, Moving Averages are one of many great indicators that can help you trade smarter and grow your portfolio.


